Start selling tickets online with our powerful ticketing platform
We empower event organizers around the globe, from destination festivals, major sporting and music events to club nights, local fairs, charity fundraisers and private galleries.
Start an event, members’ hub or virtual event for your community and discover how Eventcube can transform your business.
The event industry has seen steady change over the past few years. Growth has returned, but the way events are planned, delivered, and measured continues to shift. This article brings together the latest statistics and data points that reflect where the industry stands.
It’s designed as a resource you can return to, not a one-time read. The data highlights how budgets are evolving, how attendee expectations are changing, and how different event formats are performing across markets.
Whether you’re planning in-person, virtual, or hybrid events, these insights offer a clear view of what’s driving decisions across the industry today.
Event industry growth and market size
The event industry is growing in both scale and volume. Market size is increasing across regions, with steady expansion driven by corporate demand and continued investment in event-led marketing.
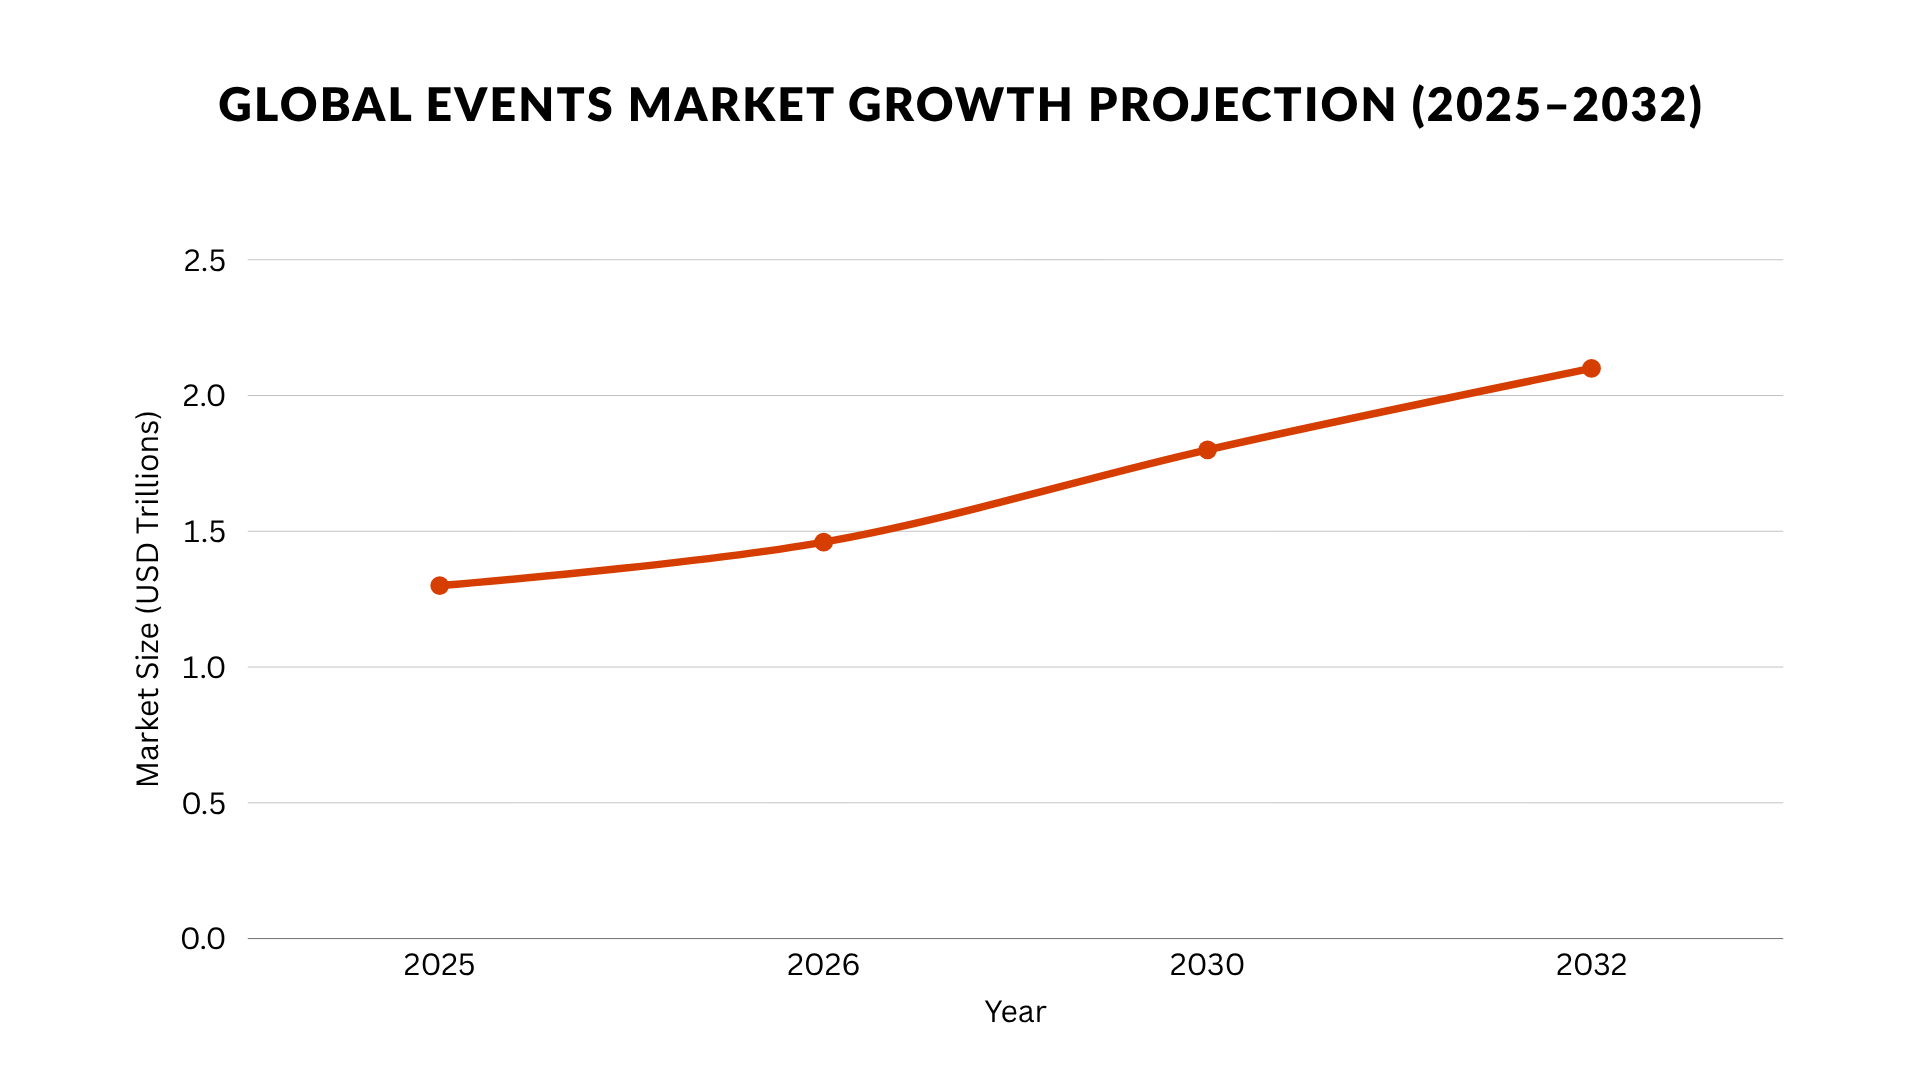
The global events industry reached $1,338.77 billion in 2025.1
It is expected to grow to $1,464.29 billion in 2026, at a CAGR of 9.4%.1
The market is projected to reach $2,086.73 billion by 2030, maintaining steady growth at 9.3% CAGR.1
The market is also expected to surpass $2.1 trillion by 2032, reflecting sustained expansion.2
The number of events increased by 52% in 2024 compared with 2023.3
What this means:
Growth is steady, which gives organizers more confidence in planning and investment. At the same time, more events mean more competition, so standing out depends on delivering clear value.
The global corporate events market reached $280.36 billion in 2025.4
It is expected to grow to $309.97 billion in 2026, at a CAGR of 10.6%.4
The market is projected to reach $458.87 billion by 2030, with continued growth at 10.3% CAGR.4
What this means:
Corporate events are driving a large share of industry growth. For organizers, this means more opportunities, but also higher expectations around delivery, experience, and measurable results.
Europe was the largest events market in 2025.1
Asia-Pacific is the fastest-growing region, driven by digital adoption and younger audiences.1
In the corporate events sector, North America leads in size, while Asia-Pacific continues to expand rapidly.1
September and April are the most popular months for external corporate events.40
January and February are the most popular months for internal events.40
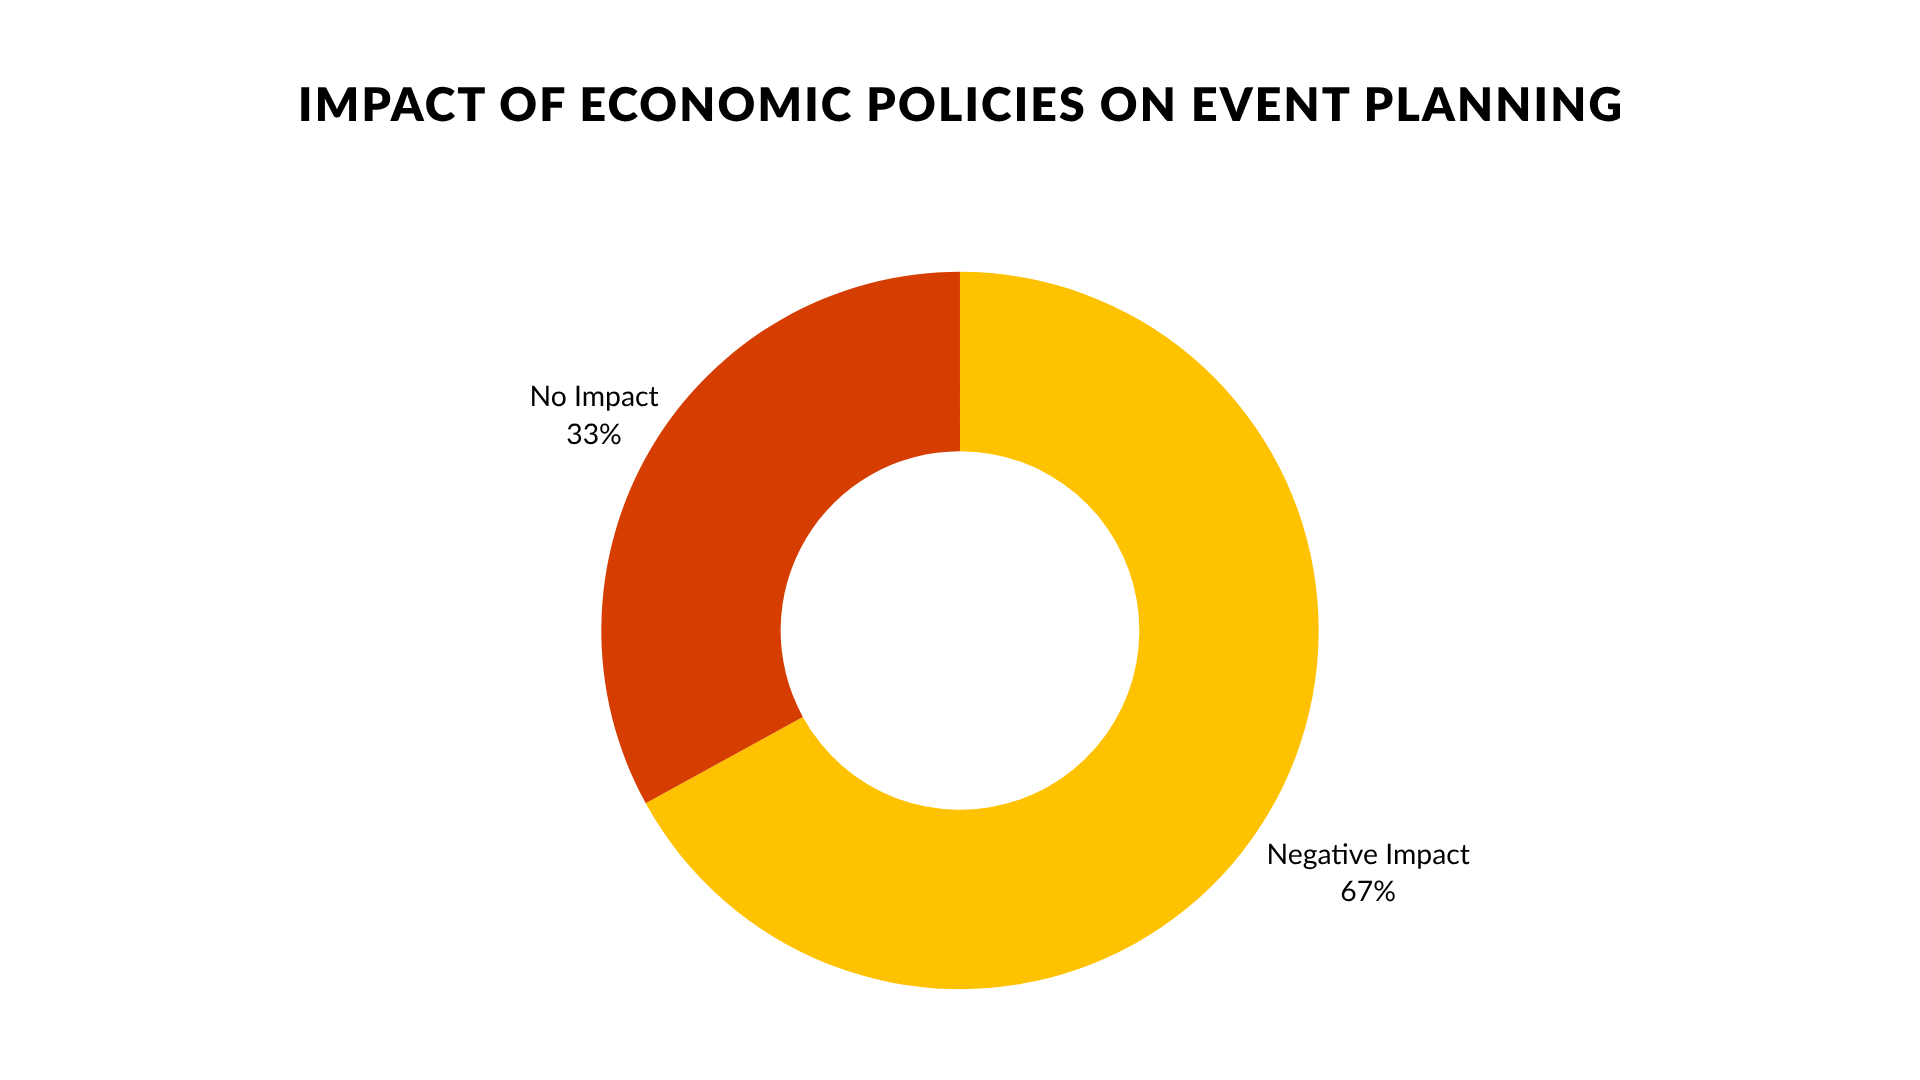
67% of planners say economic policies have had a negative impact on the industry.35
Social policies are also negatively impacting the American events industry, according to 44% of planners.35
Event budgets, pricing, and spend
Event budgets are increasing across the industry, but so are costs. Organizers are balancing higher investment with rising delivery expenses, which is shaping how events are priced, planned, and scaled.
Spending is growing, but it is also becoming more controlled. Teams are placing more focus on where the budget goes and how each decision impacts overall event performance.
67% of executives increased their meeting budgets in 2025.5
71% of companies worldwide reported an increase in event spending.6
Events account for up to 21% of total marketing budgets.7
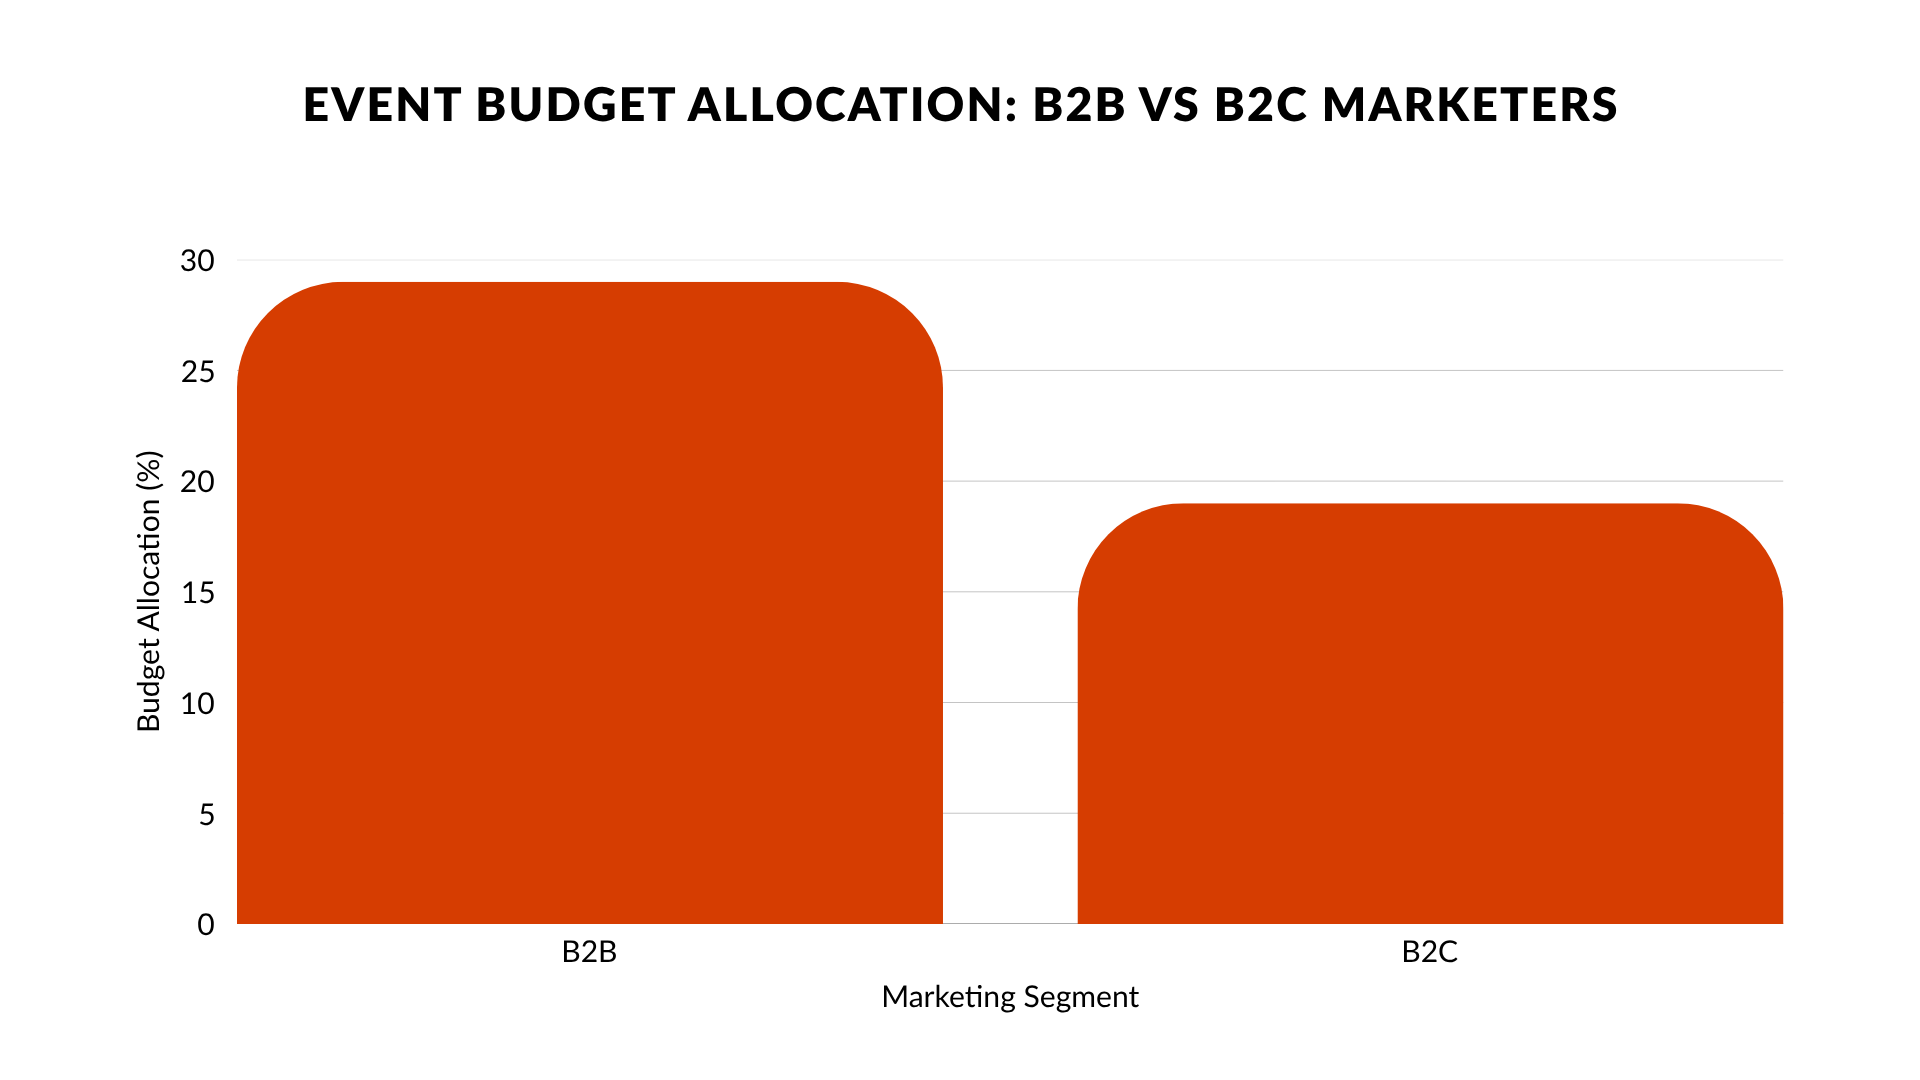
B2B marketers allocate 29% of budgets to events, compared to 19% for B2C.8
32.2% of organizers manage event budgets between $500,000 to $1 million.9
What this means:
Budgets are growing, which gives organizers more room to plan and invest. At the same time, events are taking a larger share of marketing spend, so each decision is expected to deliver clear results.
60% of organizers raised ticket prices in 2025.5
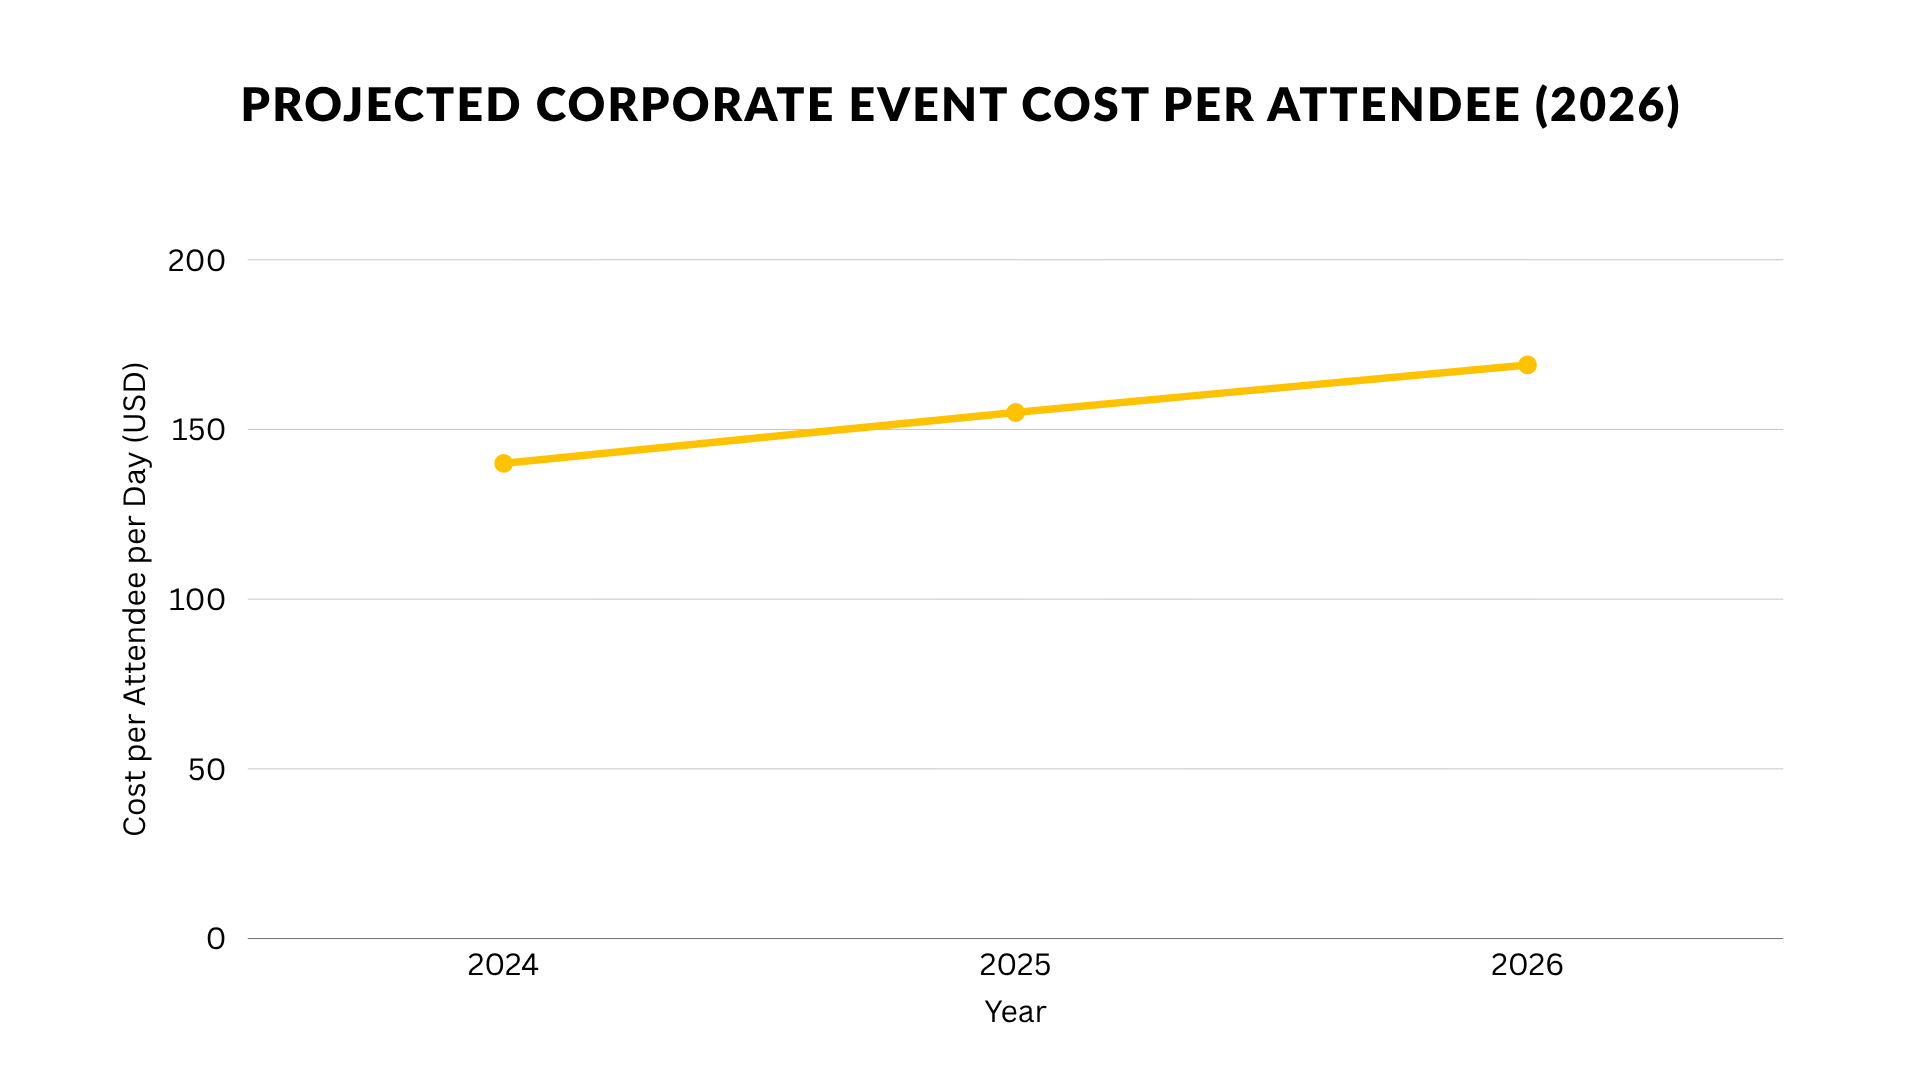
Corporate event costs are expected to reach $169 per attendee per day in 2026.10
Average ticket prices reached $41.90 in 2024, with large organizations charging up to $59.11
What this means:
Costs are rising across all formats, which is pushing organizers to adjust pricing and justify value more clearly. Higher spend per attendee means each experience needs to feel worth the price.
40% of organizers expect their events budget to grow in 2026.13
38% of planners expect cost-per-attendee increases in 2026.14
Overall meetings & events costs are expected to increase by 2.4% in 2026.40
Price increases are expected across hotels, airfare, food and beverage, and staffing.14
What this means
Cost pressure is not short-term. Organizers need to plan with tighter control, build buffer into budgets, and make trade-offs early to avoid last-minute compromises.
Event formats: In-person, virtual, and hybrid
Event types and formats are no longer fixed. In-person events have returned at scale, but virtual and hybrid formats continue to play a role across different use cases.
Organizers are not choosing one format over another. They are balancing reach, cost, and experience, which has made format decisions more strategic than before.
In-person event statistics
44% of event marketers are focusing on in-person events.39
60% of events and 14% of meetings are conducted in person.17,18
What this means:
In-person events remain a priority for most teams. For organizers, this means continued demand, but also higher expectations around quality, consistency, and results.
52.1% of organizers reported increased in-person attendance over the past year.19
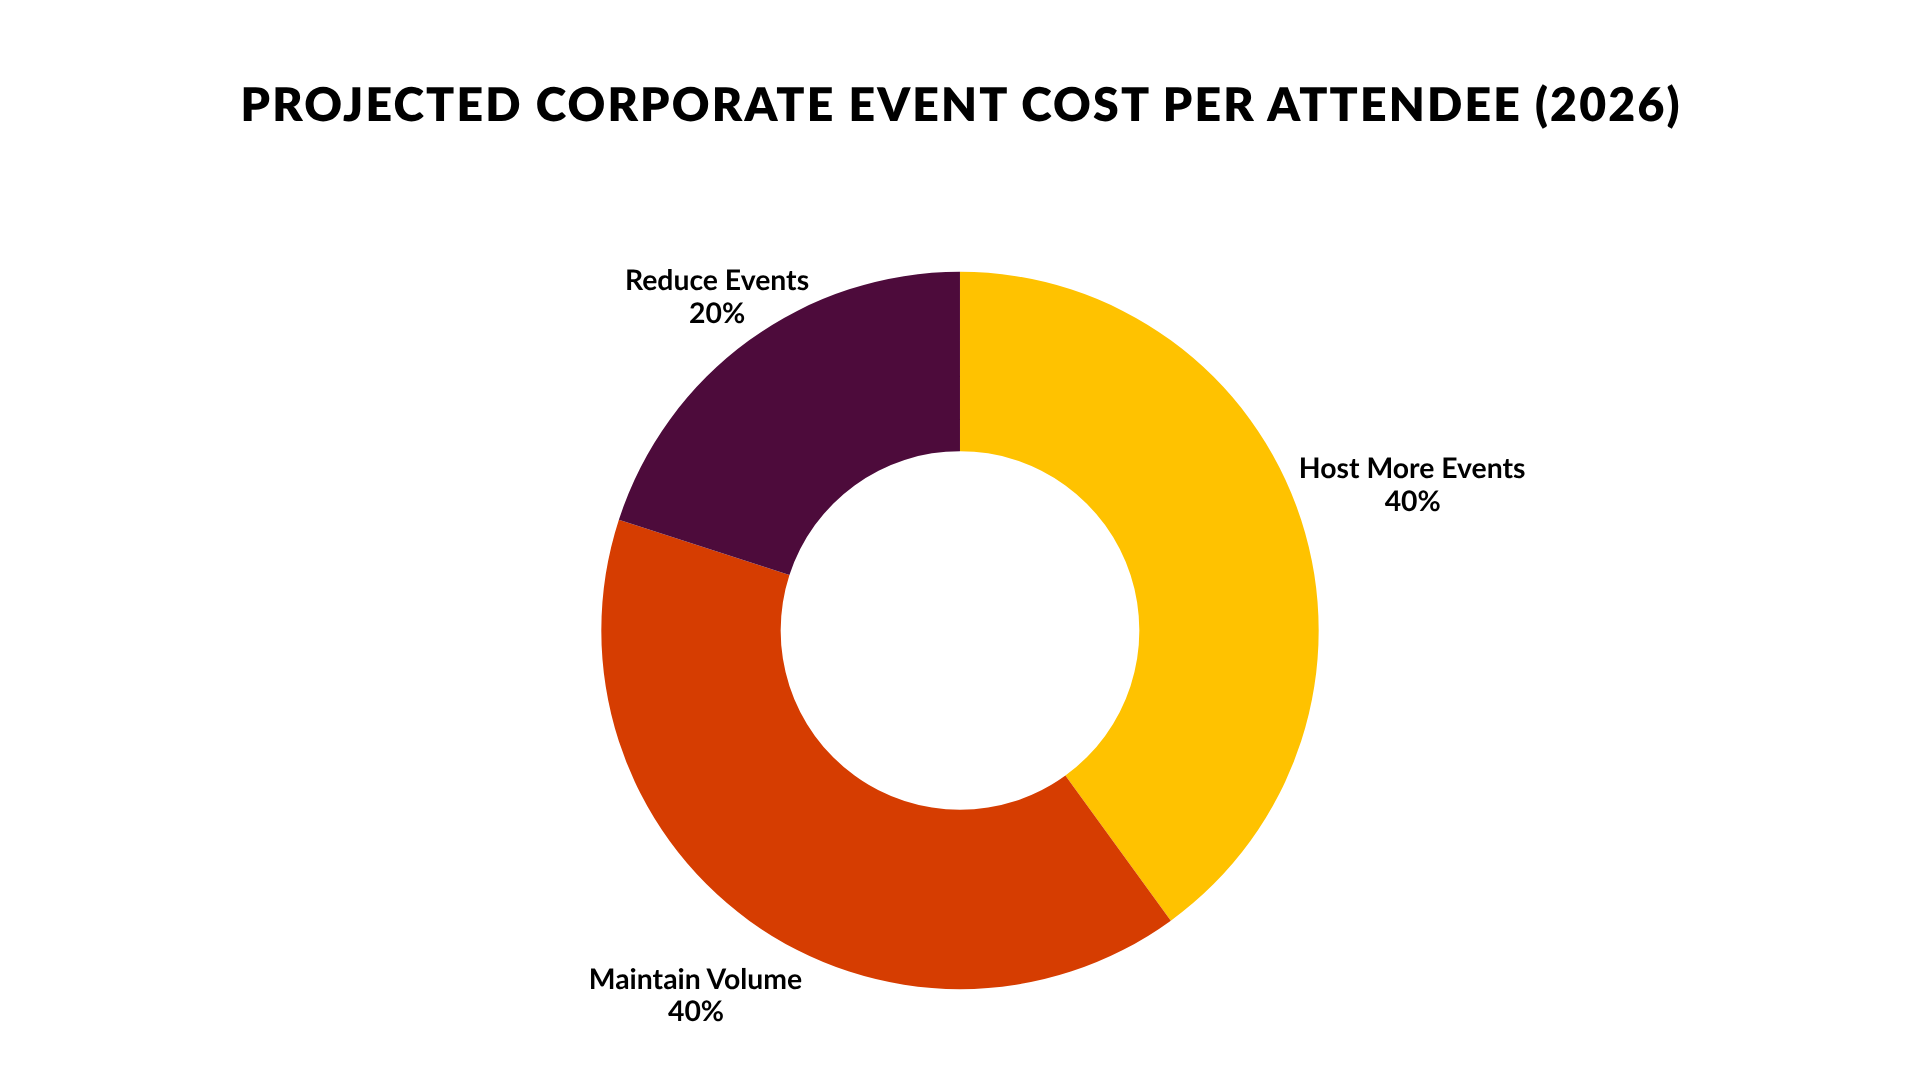
40% of organizers plan to host more events in 2026, while 40% plan to maintain the same volume.13
In-person events are 47.8% more expensive than virtual events on average.12
Virtual event statistics
The virtual events market is growing at a 23.7% CAGR.21
81% of event managers are actively hosting virtual events.5
What this means:
Virtual events are now a standard part of event strategy. For organizers, this means planning for consistent online delivery, not treating virtual as a one-off format.
92.1% of organizers rate their virtual events as successful.20
Only 1.6% of event marketers say they’ve been unsuccessful with virtual events.37
84% of attendees expect virtual options, including livestreams and on-demand access.22
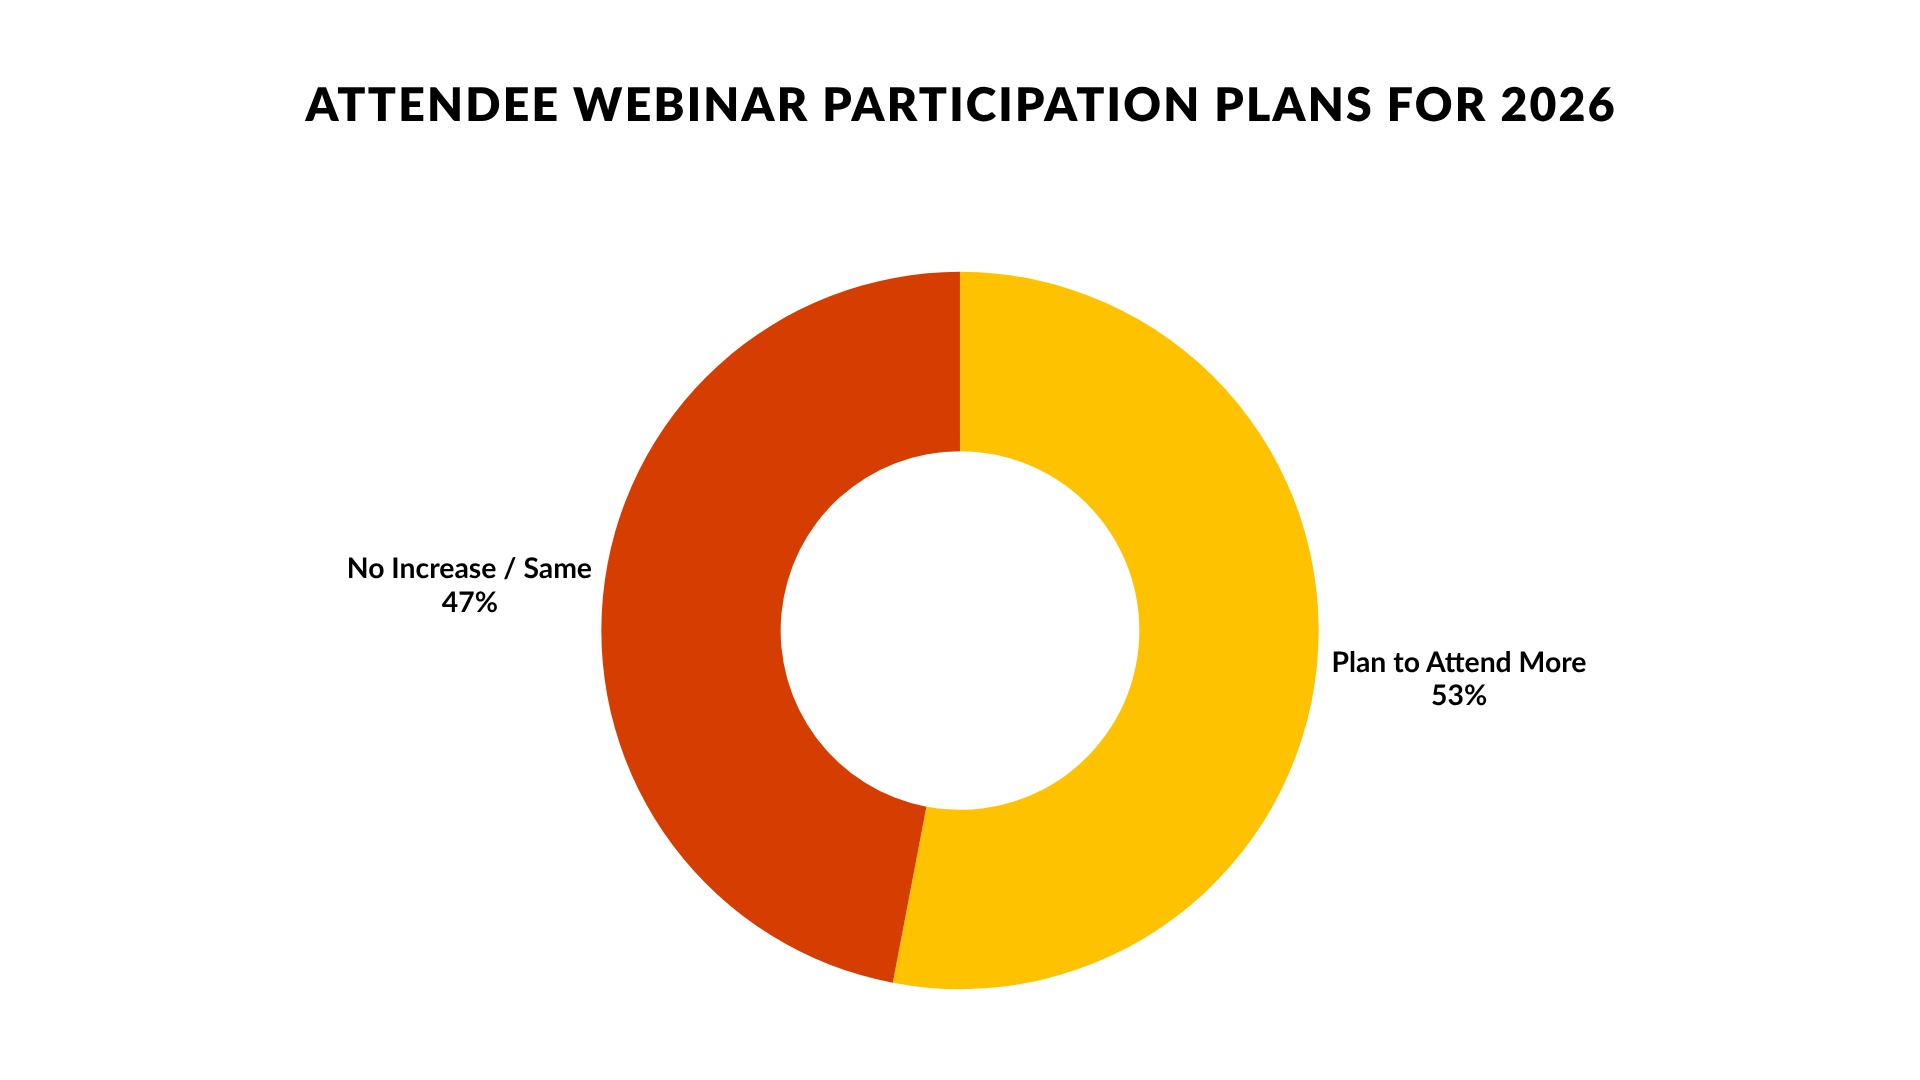
53% of attendees plan to attend more webinars in 2026.13
75% of attendees say they’ll keep attending virtual and hybrid events even after in-person events have fully resumed.37
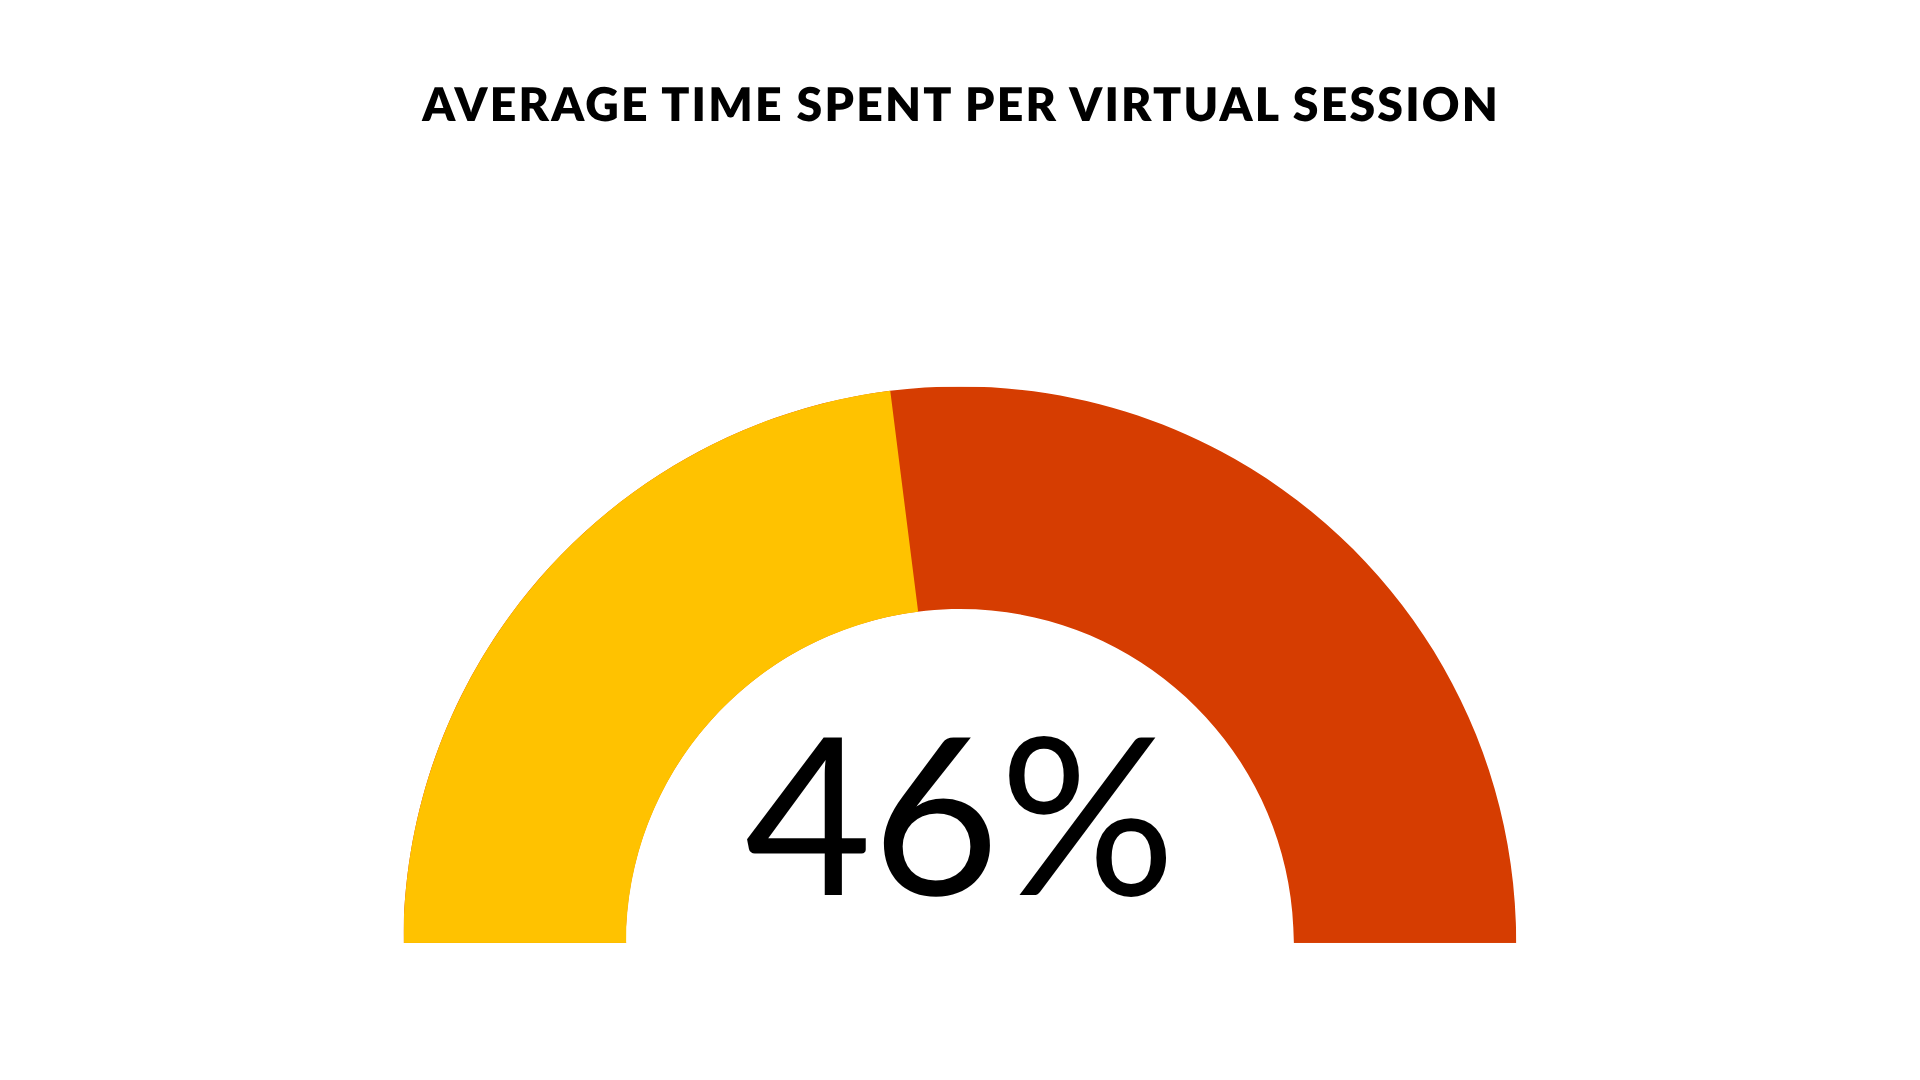
Average virtual viewing time is approximately 46 minutes per session.13
49% of event attendees want to be able to use live chat, and 39% want more on-demand content access.37
Large virtual conferences cost $1,000–$1,500 per attendee.5
What this means:
Attention spans are limited in virtual settings. For organizers, this means keeping sessions focused, building in interaction, and ensuring the experience justifies the cost.
Hybrid event statistics
74.5% of event planners are now hosting hybrid events.23
73% of attendees prefer in-person events, 41% prefer virtual events, and 50% opt for hybrid options.26
60% of associations expect hybrid and virtual events to remain a core part of their event strategy.24
91% believe hybrid or virtual events will play an important role in the future.25
What this means:
Hybrid is no longer optional. For organizers, this means planning events that work across formats and meet different attendee preferences without splitting the experience.
Attendee behavior and engagement
Attendee expectations continue to shift as events become more experience-driven. People are not just showing up for content. They are looking for connection, relevance, and value from every interaction.
This has changed how engagement is measured. Attendance alone is no longer enough. What matters is how attendees participate, interact, and stay involved throughout the event.
55% of people say in-person events help them feel more connected.27
65% of consumers say live events improve product understanding.28
What this means:
Attendees are looking for real value from being there in person. For organizers, this means designing experiences that create connection and make content easier to understand.
71% of attendees believe in-person events are ideal for networking.13
78% of attendees prefer networking in person over virtual formats.29
54% of Americans would prefer receiving a ticket to a live experience over a physical gift.5
What this means:
Attendees place high value on real-world interaction. For organizers, this means prioritizing networking opportunities and designing experiences people feel are worth showing up for.
Over 67% of event attendees say that having free time outside of structured sessions, parties, and networking is essential to their overall event experience.5
More than 61% of millennials and 63% of Gen Z attendees plan to attend more global events in 2026.5
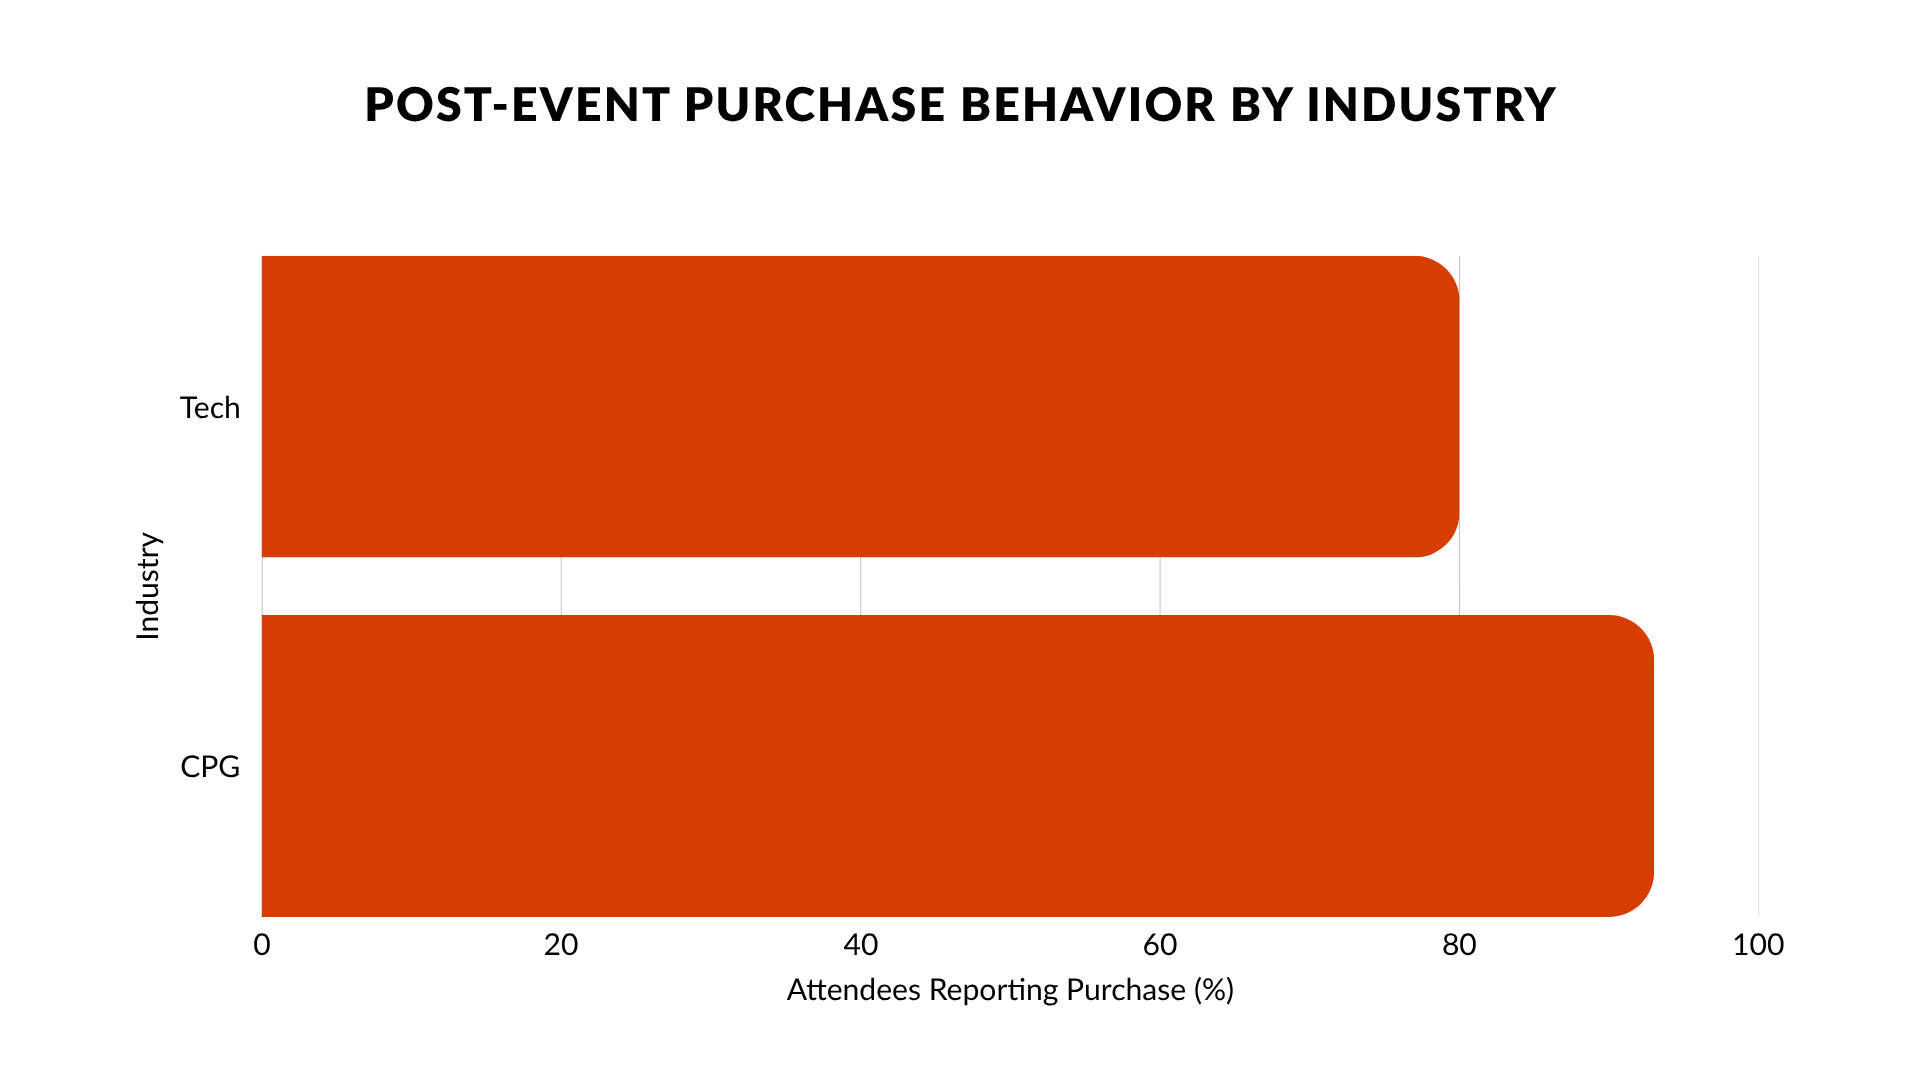
80% of event attendees in the tech space and 93% of CPG (consumer packaging goods) industry event attendees report purchasing from a brand after attending their events.35
56.9% of virtual attendees are open to hybrid conference formats in the future.30
What this means:
Attendees want flexibility, meaningful experiences, and clear value. For organizers, this means building space into agendas, appealing to younger audiences, and creating events that drive both engagement and real business outcomes.
Event marketing, sponsorship, and ROI
Events continue to play a central role in marketing strategies. They are used to build relationships, support sales, and create experiences that other channels cannot replicate.
At the same time, expectations around performance have increased. Teams are under pressure to show clear returns, track outcomes, and connect event results to broader business goals.
Event marketing statistics
Events are seen as critical for business growth by 89% of marketers.33
77% of marketers prioritize experiential marketing.32
What this means:
Events are now a core part of marketing strategy. For organizers, this means focusing on experiences that support long-term growth, not just one-off campaigns.
72% of marketers consider event marketing their most effective tool.33
95% say in-person events help achieve business objectives.13
90% of marketers say that events help their company stand out from the competition.33
What this means:
Events are expected to deliver clear results. For organizers, this means aligning event goals with business outcomes and ensuring each event contributes to measurable impact.
28% of businesses use event marketing to support sales.5
79% of U.S. marketers utilize event marketing specifically to generate sales leads.5
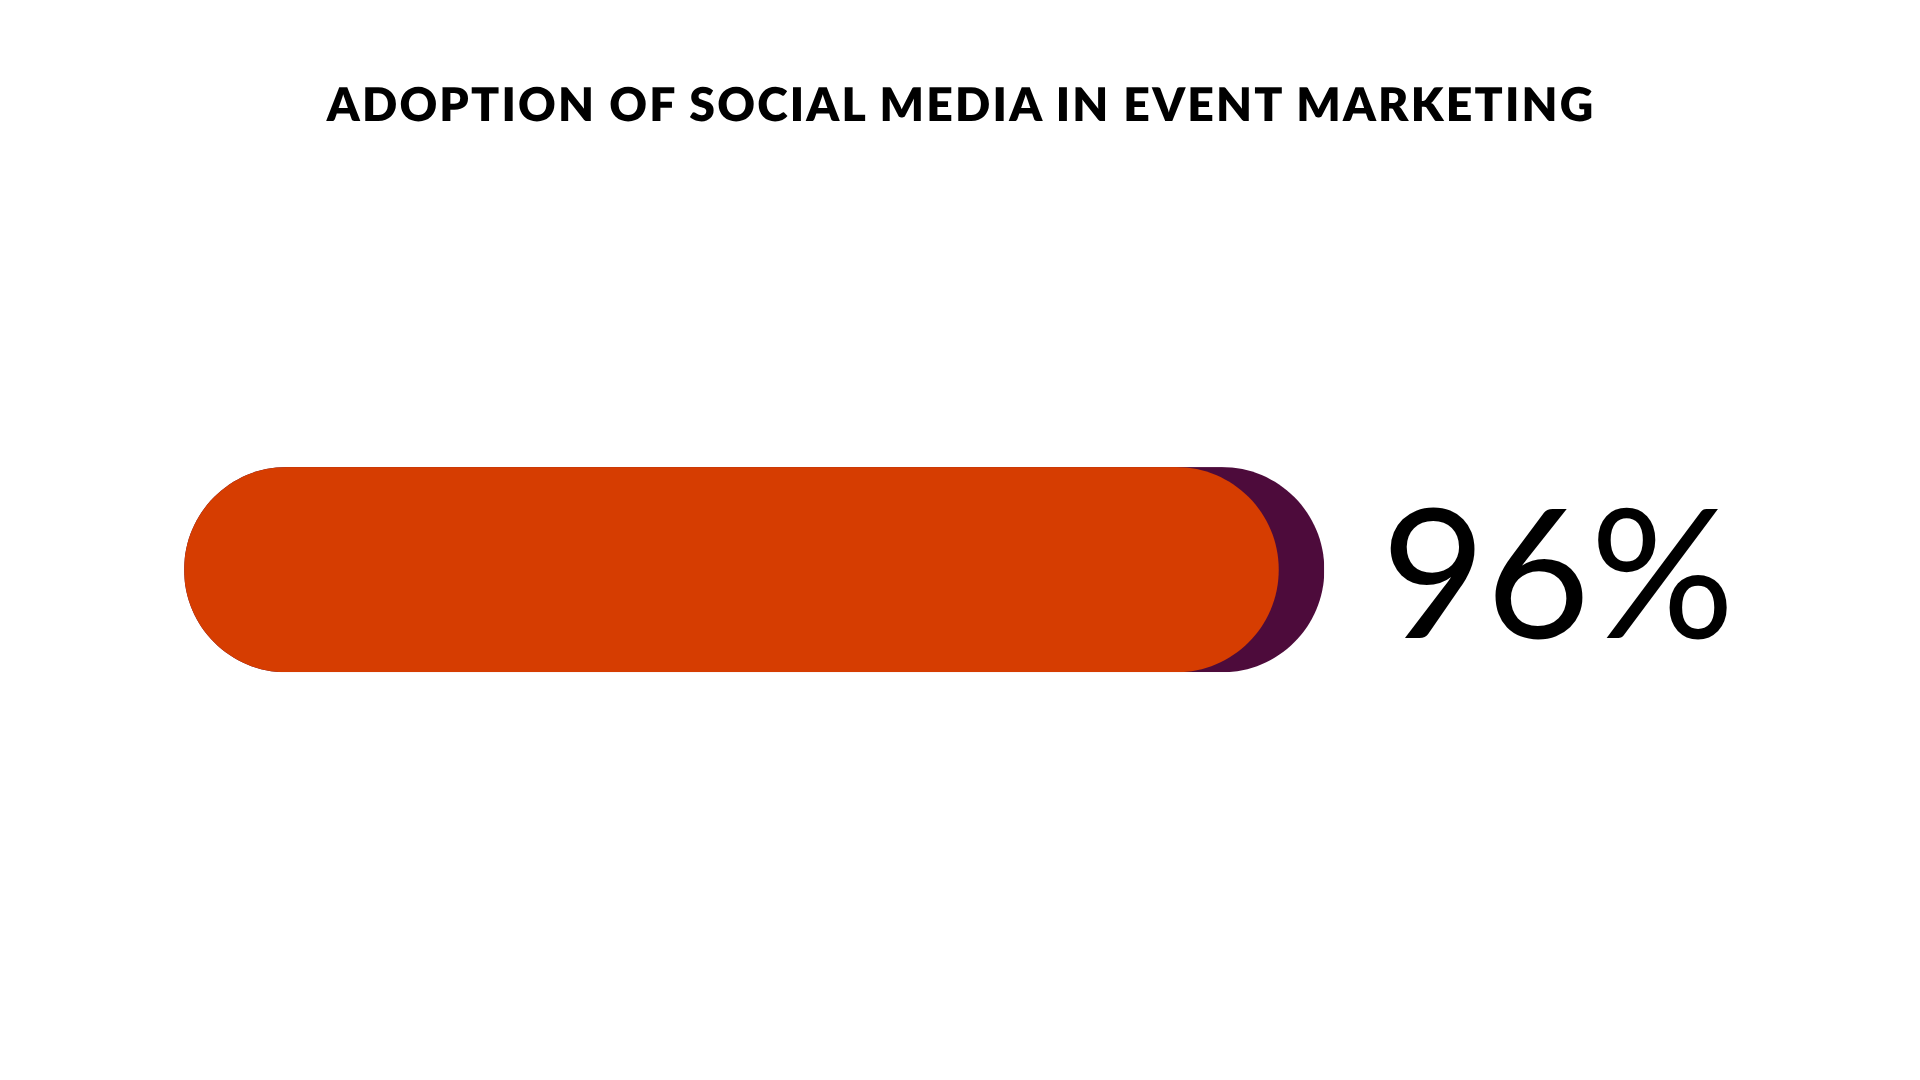
96% of event professionals are using social media event marketing to increase awareness of their events.32
Event ROI statistics
The average ROI for events is in the 25-34% range.32
66% report higher ROI from virtual events compared to physical events.38
What this means:
Events can deliver strong returns, but expectations are rising. For organizers, this means focusing on formats and strategies that maximize impact while keeping costs under control.
52% of marketers attribute at least half of their company’s 2024 closed-won deals to events.33
94% of marketers say events help their team generate a steady flow of revenue.33
19% of marketers say conferences and trade shows generate the most revenue for prospect-focused events.33
17% of marketers say product launches generate the most revenue for customer-focused events.33
What this means:
Events are directly tied to revenue, not just awareness. For organizers, this means focusing on formats and experiences that support both lead generation and customer conversion.
31% report a 20-30+ day decrease in their sales cycle due to their events.33
40% of organizers report difficulty proving event ROI in 2026.13
Approximately 26% of event marketers say they lack the time to effectively measure the success of their events.5
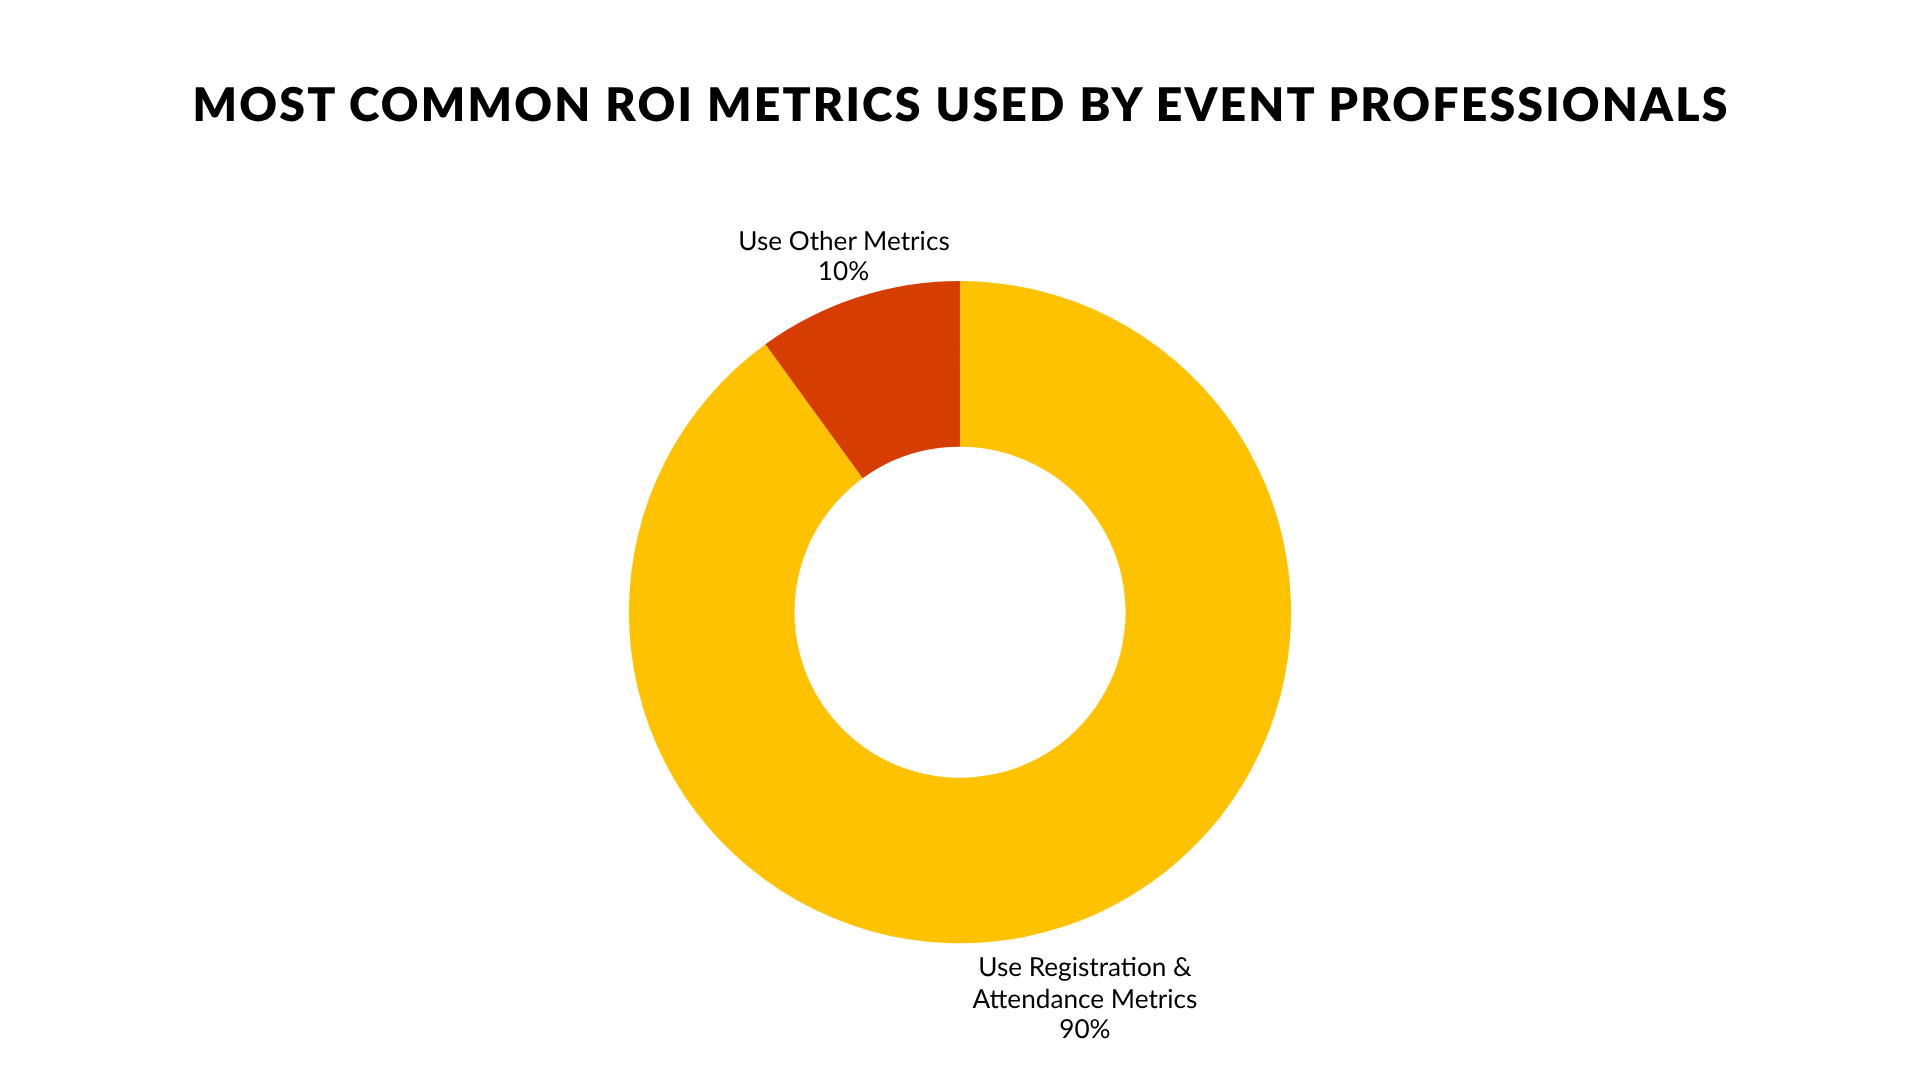
Many marketers aren’t tracking event registrations (54%), opportunities created (53%), or attendance rates (40%), the three key metrics for establishing ROI.35
90% of event professionals who are tracking ROI say they use registration and attendance as metrics.35
92% planned to improve their post-event attendee follow-up.35
Sponsorship statistics
51% expect to plan more sponsored events.33
Nearly 66% of sponsorship teams expect revenue to grow this year. 34
35% of meeting professionals say seeking funding, such as from sponsors, is a top way they’re combatting economic uncertainty in 2026.35
What this means:
Sponsorship is becoming a key growth lever. For organizers, this means building stronger sponsor strategies and treating sponsorship as a core revenue stream, not an add-on.
91% of event organizers take on sponsors for their event sessions to generate extra sponsorship revenue.35
65% of event organizers accept sponsorships for their events.35
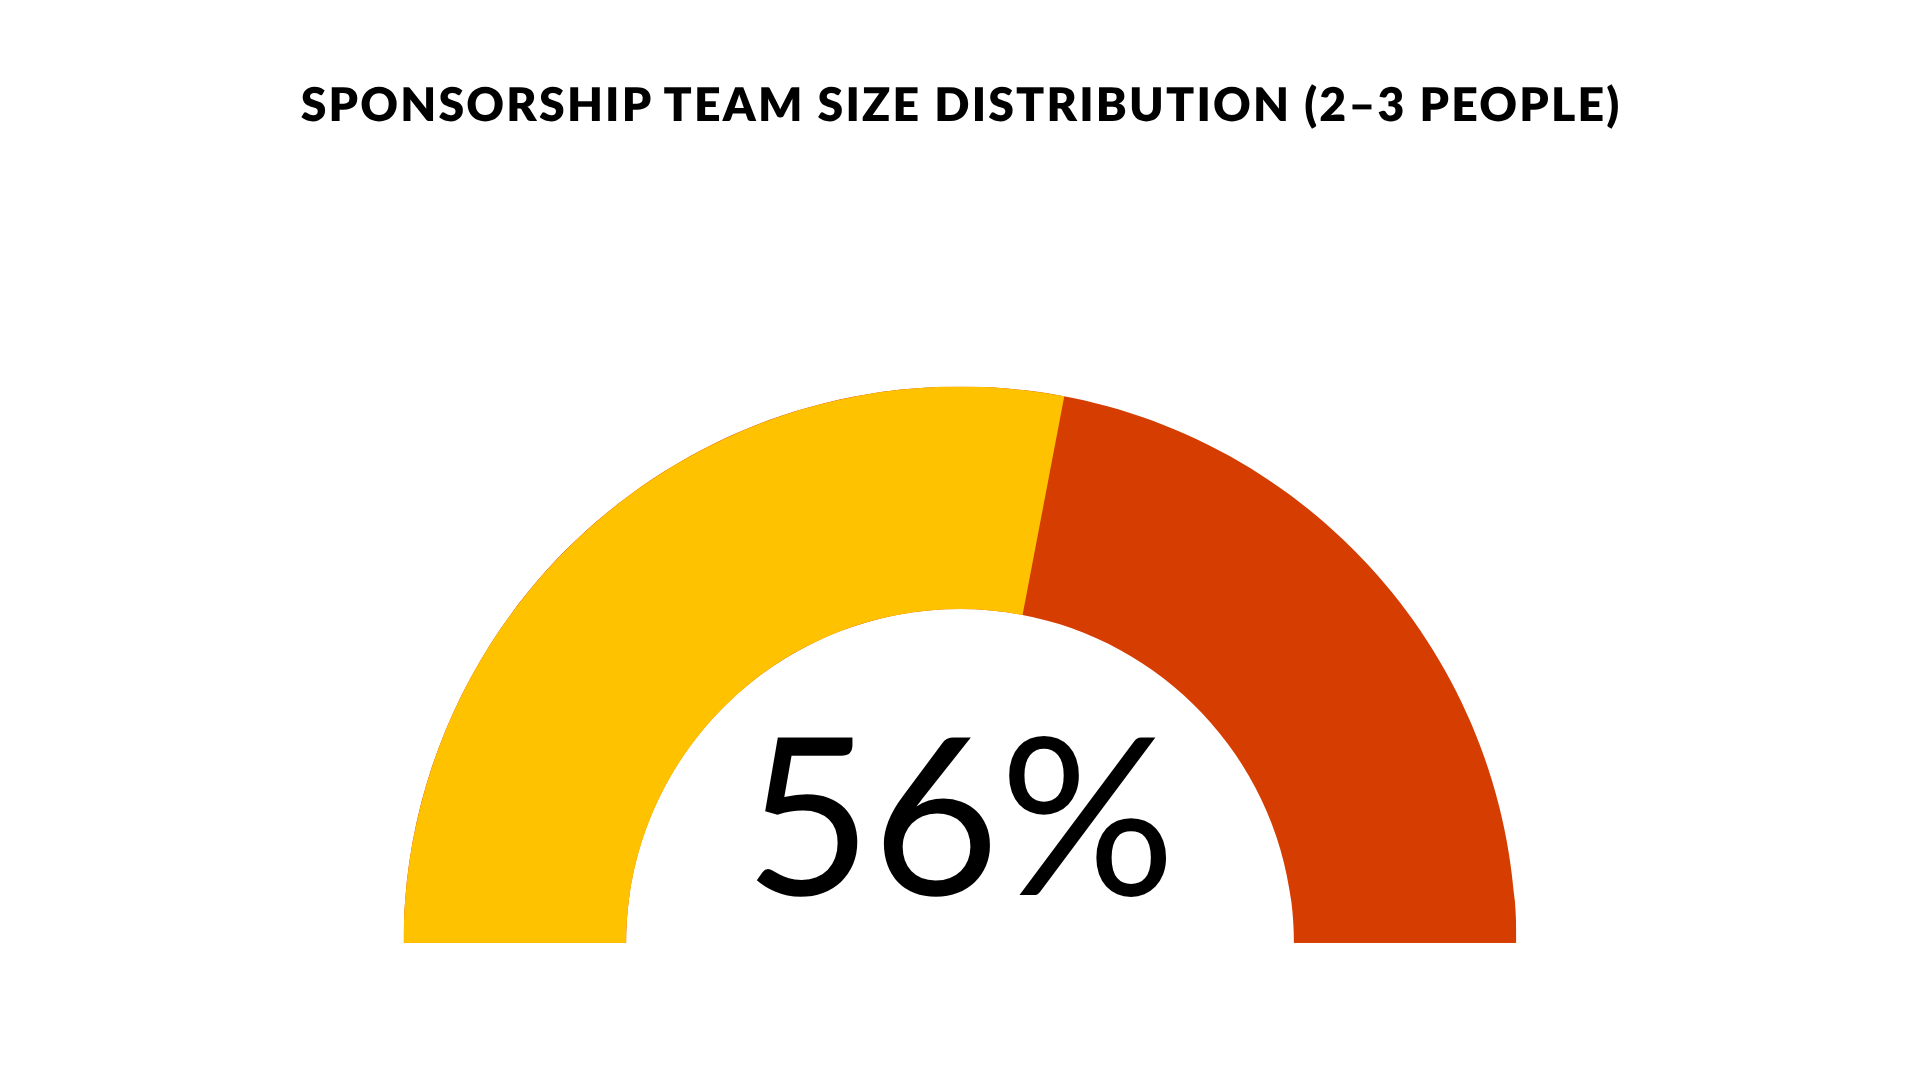
Most sponsorship teams are small, with 56% operating with just 2 to 3 people.34
53% of organizations spend more money on sponsoring and attending events compared to hosting events (47%).35
Most sponsorship teams are small, with 56% operating with just 2 to 3 people.34
What this means:
Sponsorship is widely used, but teams are often lean. For organizers, this means focusing on scalable sponsorship packages and efficient processes to manage partnerships without adding complexity.
Event technology and AI adoption
Technology now shapes how events are planned, delivered, and measured. From virtual event platforms to AI-driven tools, organizers are relying on tech to improve efficiency, scale operations, and create more consistent experiences.
78% of marketers used event technology in their efforts in the past 12 months.33
72% of meeting professionals use specific technology or software for managing most or all of their meetings programs.35
What this means:
Event technology is now standard across the industry. For organizers, this means choosing tools that support scale, efficiency, and consistency across every event.
68% of marketers use an event platform that integrates with the rest of their tech stack.33
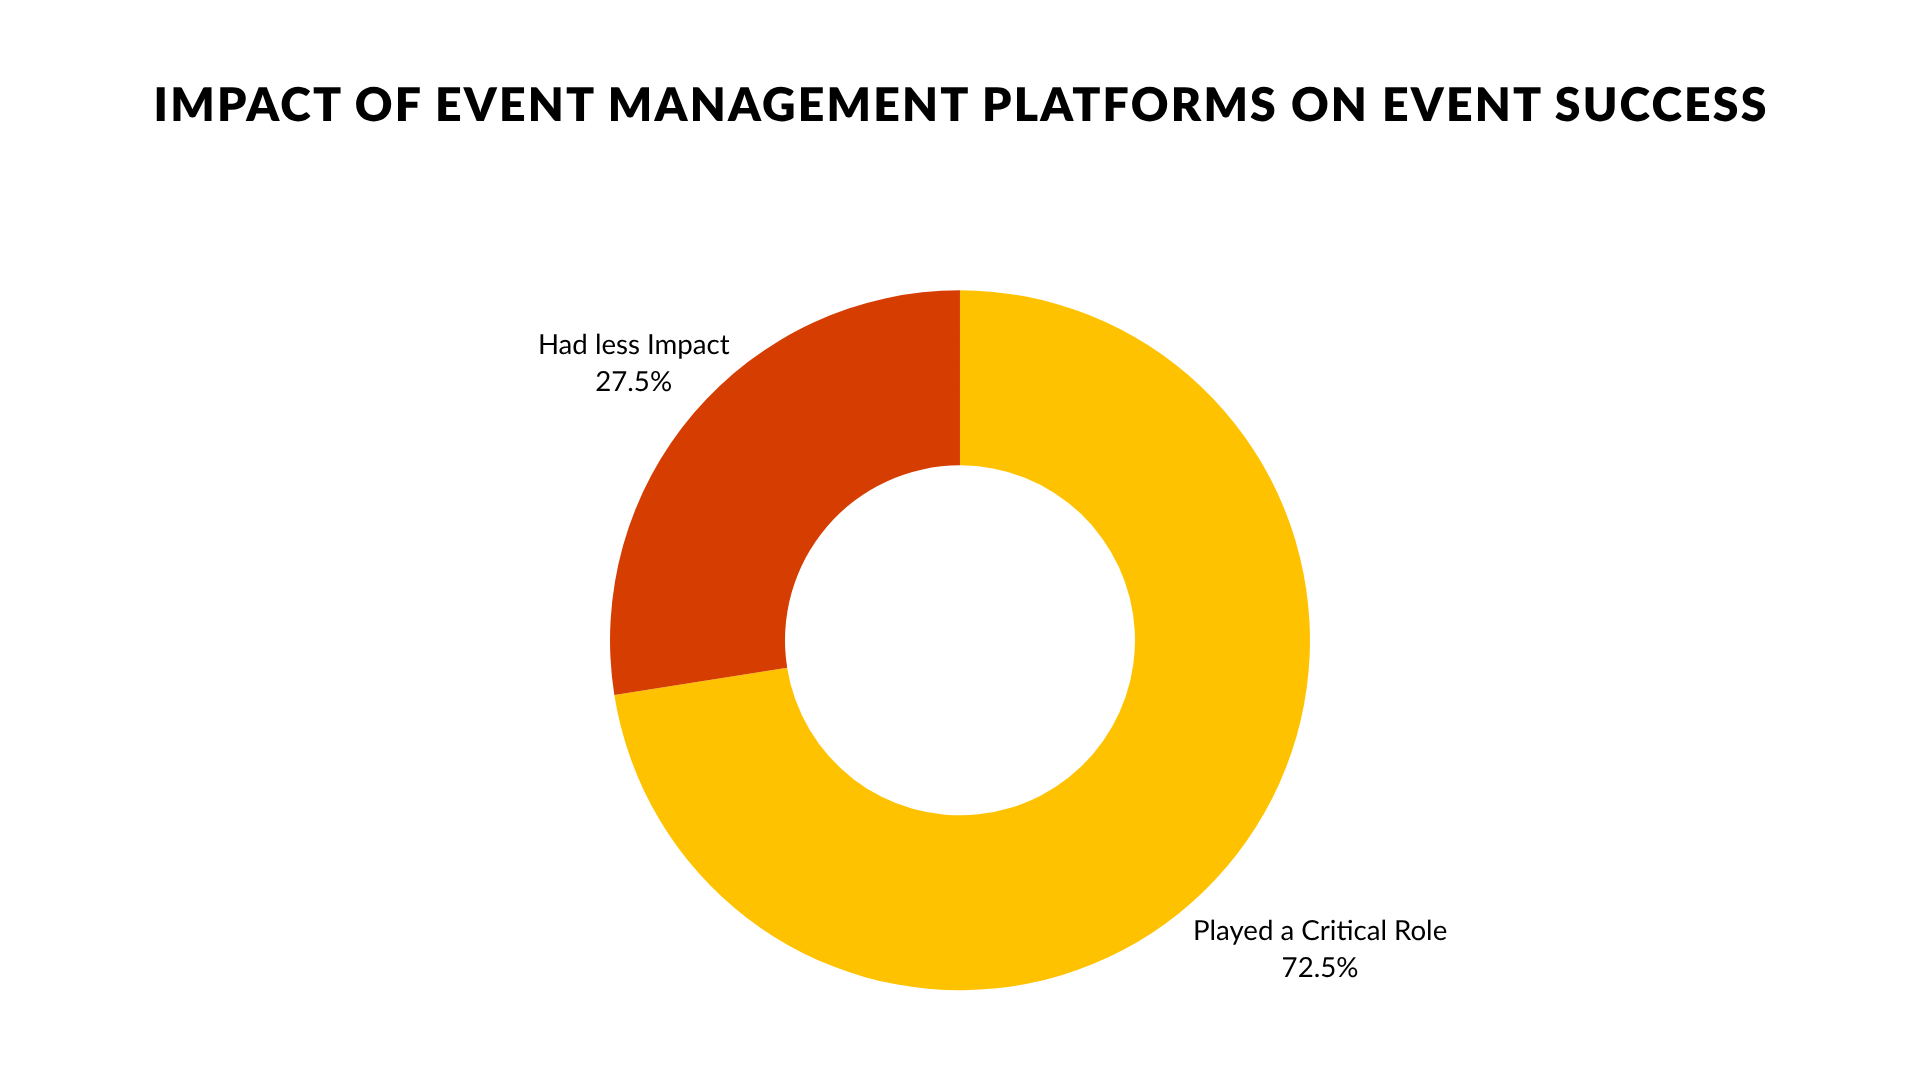
About 72.5% of event organizers believe that their event management platform played a critical role in the success of their most recent event.5
77% of marketers say their company would host more events if they had technology that made it easier to create and replicate events.33
What this means:
Technology is directly tied to event performance. For organizers, this means investing in platforms that integrate well and make it easier to run events consistently at scale.
64% of organizers plan to change their event management software vendor within the next year.13
Only 22% of event teams use dedicated sponsorship management software.34
Event apps and attendee tech
73% of attendees expect in-person conferences to use modern event technology.13
55% of attendees say the mobile event app can make or break their experience.13
What this means:
Attendees expect technology to be part of the experience. For organizers, this means ensuring tools like event apps are reliable, easy to use, and fully integrated into the event journey.
Around 86% of event marketing professionals believe that technology has a significant positive impact on event outcomes.5
89% of businesses that use event technology say it saves them around 200 hours per year.35
Only 24% of event teams have fully integrated event tech and marketing/sales systems.35
What this means:
Technology drives efficiency and results, but integration remains a gap. For organizers, this means choosing tools that connect with existing systems and reduce manual work across teams.
AI in events
95% of respondents expect their organization’s use of AI in events to increase.13
50% of meeting planners are using AI to help them plan and execute an event.35
What this means:
AI adoption is accelerating across the industry. For organizers, this means building AI into workflows now to stay competitive and improve planning efficiency.
75% of planners say they use AI tools during their venue sourcing process.35
41% of planners use AI to analyze attendee data to find a better venue fit.35
66% of event professionals agree AI allows them to “focus on higher-value tasks.”35
What this means:
AI is shifting time away from manual tasks. For organizers, this means using AI to make faster decisions, improve targeting, and focus more on strategy and experience design.
37% of marketers don’t know how to effectively use AI in event planning.33
Only 11% of organizations globally say they have achieved a high level of AI use in their event processes.36
Takeaway
Based on these events industry statistics, it's clear the event sector is experiencing significant growth and transformation. Driven by technological advancements, changing consumer preferences, and strategic corporate initiatives, this dynamic industry is evolving to meet new challenges and opportunities. As organizations navigate this landscape, the importance of effective event management solutions becomes evident.
For those looking to get more from their event strategy, Eventcube brings everything together in one place. Create a free store to start building and managing your events with full control.
With extensive experience in events and technology, our platform, Eventcube, has powered over 100,000 events across the globe, attended by more than 15 million people. Our expertise ensures every event, whether in-person or virtual, is a standout success. Our goal is simple: to help our clients create and host extraordinary events.